Analysis Coffee Sales
I built an interactive Power BI dashboard and an automated Excel report for a fictitious coffee chain (Nordic Coffee AB).
The goal: turn scattered data into clear insights and simulate a daily refresh system.
Att förstå försäljningsmönster per butik och hur interna och externa faktorer påverkar resultatet – för att möjliggöra smartare och mer lönsamma beslut.

Real-time sales visibility for stock and promotion decisions. Customer segmentation (new vs returning, by location, average ticket). Measurement of campaign impact on sales and web traffic. Reduction of manual reporting time (3–4 hours/week).
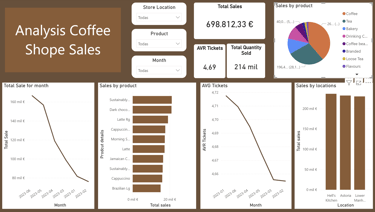
Power BI Dashboard with interactive KPIs and visuals.
Excel Automated Report connected to the Semantic Model in Power BI.
Simulation of daily data refresh.
Strategic recommendations for sales, products, locations, and ticket value.
Sales show a progressive decline from January–June 2023 → requires seasonal campaigns.
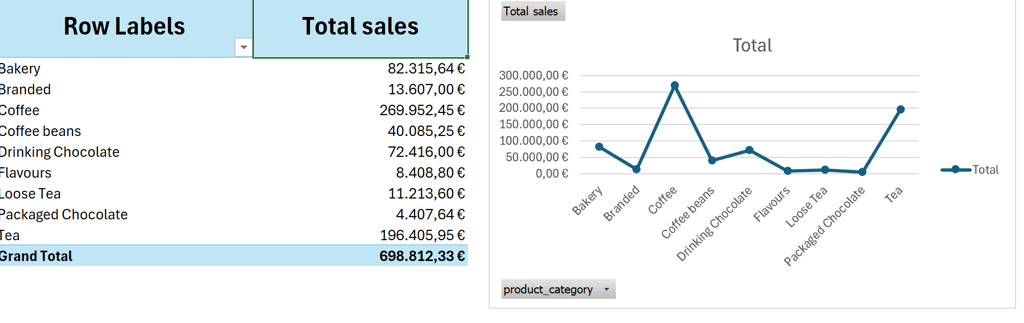
Sustainably Coffee and Dark Chocolate Drinks are top-selling products.
Hell’s Kitchen and Astoria stores generate similar revenues (~€200k).
Average ticket is relatively low → upselling opportunities.